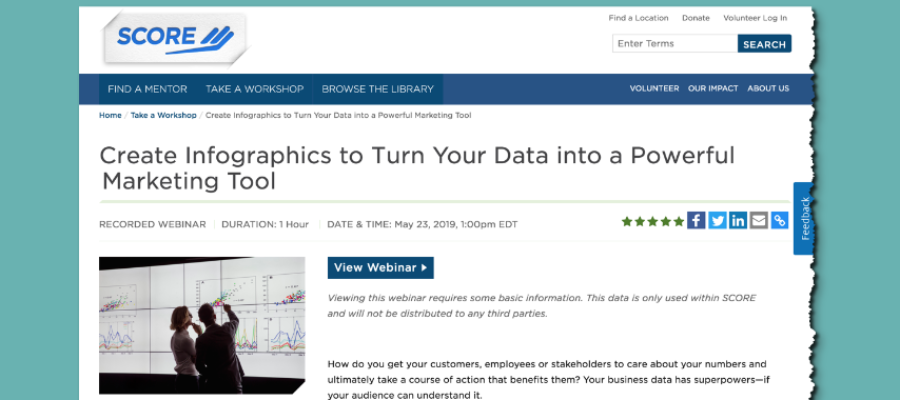
CLICK HERE to visit SCORE.org to watch the recorded webinar.
How do you get your customers, employees or stakeholders to care about your numbers and ultimately take a course of action that benefits them? Your business data has superpowers—if your audience can understand it.
On behalf of Easelly, I discuss how to create an infographic story about your data that’s engaging and powerful. Your infographics will be able to transform a lead into a customer, motivate employees to reach their goals, complete a business plan that bankers can’t resist, and much more.
You’ll learn:
- The essential elements of an infographic data story
- Ideas for using your data in an infographic to meet your business goals
- Easy ways to storyboard your data for an infographic


